The other day, I posted about the statistics of HelloTalk.
Since then, I have wanted more details on the statistics, so I made dedicated software to solve this.
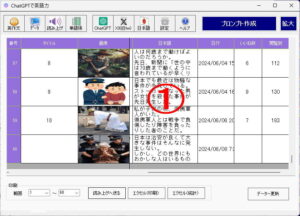
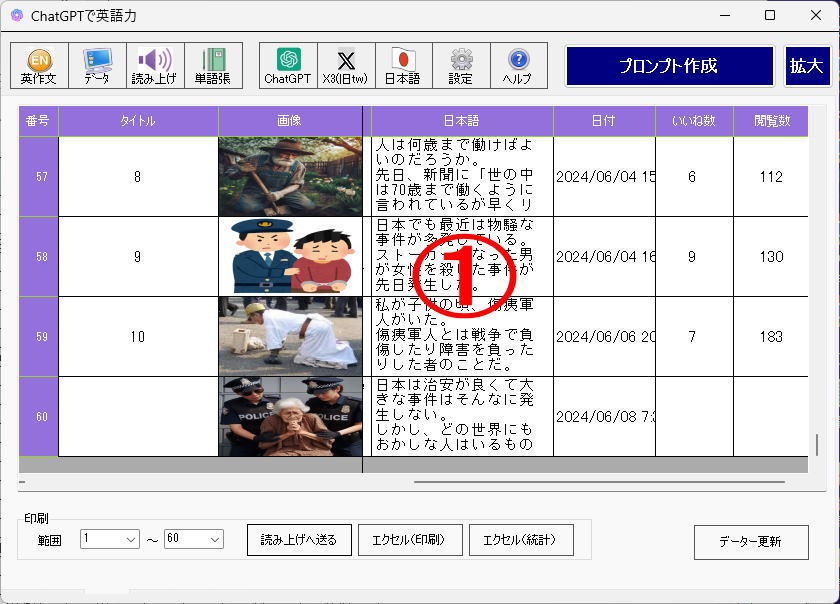
You can register both “like and post time” as shown in picture.
Moreover, you can register them later in the database.
And get statistics from those data.
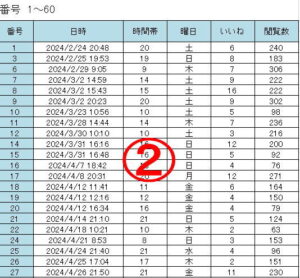
When you push the “Excel (Statistics)” button, you can automatically generate an Excel file.
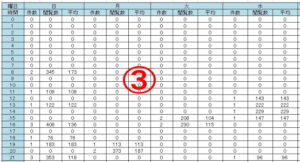
Picture 2 shows raw data, and picture 3 shows statistics by the day of the week or time.
It is very convenient to get statistics with just one button push.
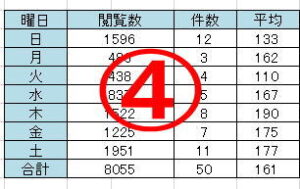
Pictures 4 and 5 are graphs from those data.
According to this, the highest number of page views is on Thursday, and the time zone is 9 PM.
By week and time, I would like to summarize when I get more data.
By the way, when I posted these statistics the other day, I got some feedback.
We should have data by target country, time zone, etc.
I also want to get those data.
However, where are those raw data, and how can we get them?
If someone knows where to get or how to get them, I sincerely want to know.
先日、HelloTalkの統計についてポストした。
あれから、もっと統計を取りたいと思い、専用のソフトを作成した。
写真①のとおりであるが、投稿文、投稿時間を登録できるようにした。
さらにこのデータベースにはいいね数や閲覧数も後で登録できる。
このデータを元に統計が取れるようにしている。
「エクセル(統計)」ボタンを押すと図のとおりエクセルデータができあがる。
②は生のデータ、③④は曜日、時間ごとに集計している。
ボタン一つで瞬時に統計が取れるのはとても便利が良い。
これを元にグラフ化したのが➄、⑥である。
これによると閲覧数木曜日が一番多く、時間帯は9時台が一番多い。
曜日、時間別についてはデーター数が増えてから集計したい。
ところで、先日のポストに対して色んな意見があった。
ターゲットの国別だとか、タイムゾーン別とか。
私としても是非そのような統計を取りたいと思っている。
しかし、その元データはどこにあるのだろうか。
元データの入手先、入手方法を知っているかたは是非教えてほしい。(07時19分)